Call outcomes
From received to resolved, step by step: each call sits in a single box and the totals add up. Click a bar and you will see those calls in Conversations.
On this page
Call analytics: your call outcomes, in verifiable figures
The panel counts how many calls your business receives, how many the agent resolves, what it gets done on each one and when they peak. The figures come from your own calls, not from estimates, and from them you can go straight to the conversations behind them.
Choose a period and the panel compares it with the previous one: by day up to a month, by week up to six months and by month beyond that, with up to 400 days of history. You can filter by agent, by phone number and by channel.
From received to resolved, step by step: each call sits in a single box and the totals add up. Click a bar and you will see those calls in Conversations.
The calls with each outcome. Only what the agent actually completed counts: if the calendar lookup failed, there is no appointment.
The week, hour by hour and in your business’s local time. To organise shifts and decide how many simultaneous calls you need.
How many calls found every line busy, at what times it happened, what the caller heard and how many got through after waiting.
5 of the 6, on Mondays from 9:00 to 10:00. If this keeps happening, you can expand to up to 25 simultaneous calls.
Speed, lookups that succeeded and how the tone of each conversation ends, by agent and by version. That way you can see whether a change to the script makes things better or worse.
How many different people call and how many call back. Phone numbers are counted, but not shown.
When there is enough data, the panel highlights up to three facts from the period: which figure has changed, in which time slot calls went unanswered, the most frequent review reason or the hour with the most calls.
No language model involved: only when the period has at least 30 calls and a figure changes by at least 10%, so that coincidences are not flagged.
Call outcomes, actions, review reasons and each agent lead to the list of those calls, with their transcripts and summaries.
Today’s calls compared with yesterday’s up to the same time, and how many are in progress right now.
Calls are up 12% on the previous 30 days.
On Mondays from 9:00 to 10:00, 5 calls did not get through: no line was free.
The time slot with the most calls is Mondays from 9:00 to 10:00, with 14.
Example made up for this page: the observations come from your business’s calls.
Calendar and sales funnel figures, with the same rules: a period, the comparison with the previous one and no personal data.
How many appointments the agent books, how many are confirmed through reminders and how many people turn up. Test sends do not count.
New leads and where they come from, close rate, days in each column and those that have not moved for more than two weeks. The funnel’s AI comments on these same figures.
In “Ask your data”, you write the question as you would ask it in a meeting. The language model only interprets what you want to know; the server does the counting on your data, and the answer shows the figure and the table it comes from.
How many people missed their appointment in September?
In September, 11 people did not turn up, out of 254 appointments: 4.3%.
from 01/09/2026 to 30/09/2026
Other questions
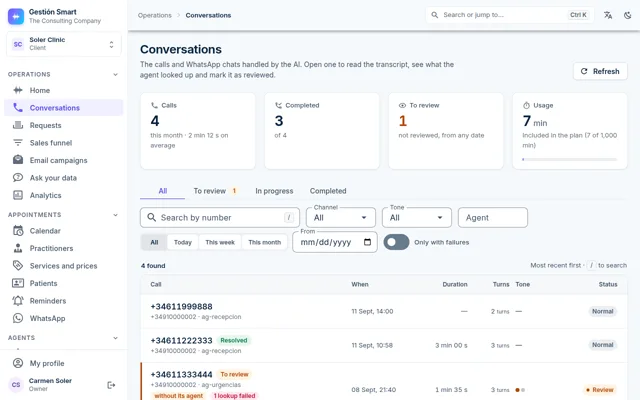
Every conversation is kept in the panel with its transcript, its summary and what the agent did. From there you can review what did not go well.
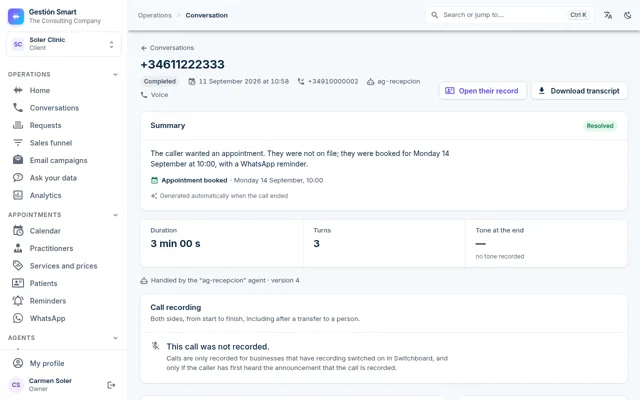
When the call ends, a summary classifies it as “Resolved”, “Unresolved” or “To review”, with the actions the agent actually completed.
A lookup that failed, a message taken, an open request, a caller getting angry or a call that ended without an appointment.
How long the agent took to start replying in each turn: up to 2 s is normal; from 2 to 4 s, slow; over 4 s, worth reviewing.
The emotion in each turn, to see whether the call ended better or worse than it began.
The analytics count calls, not people: they help you decide without exposing anyone.
Different people and repeat callers are counted, but no number or name appears in the analytics.
Each query is limited to your business, and only the owner and billing roles can see the cost of the service.
In healthcare businesses, no clinical data reaches a language model.
From your own calls. The server counts them from the record of each conversation, with a single definition for each figure across the whole panel. No language model does the counting or estimates results.
When the call ends, the AI summarises it and classifies it as “Resolved”, “Unresolved” or “To review”. If a lookup failed or there is any reason to review it, it does not count as resolved, even if the agent booked the appointment. Actions, such as an appointment booked or a message taken, only count when the agent completed them.
Yes. In Conversations you can filter calls by date, agent, channel, tone or status, and open each one with its transcript and summary.
Any role in the business can see the call figures. Only the owner and billing roles can see the cost of the service.
In Spanish, English, German, French, Italian and Portuguese. Each person sees the figures and labels in their own language.
At no extra cost: it is part of the panel, which is included in the single plan at €120 + VAT a month with 1,000 minutes of conversation. Each additional minute costs €0.65 + VAT.
You call the agent from your mobile and then we go through the call together in the panel: the transcript, the summary and what the agent got done. The consulting to set it up is free of charge.